
India's home loan market has undergone a quiet but structurally significant shift: smaller cities, not metros, are now where most new home loan volume is coming from.
What the data shows
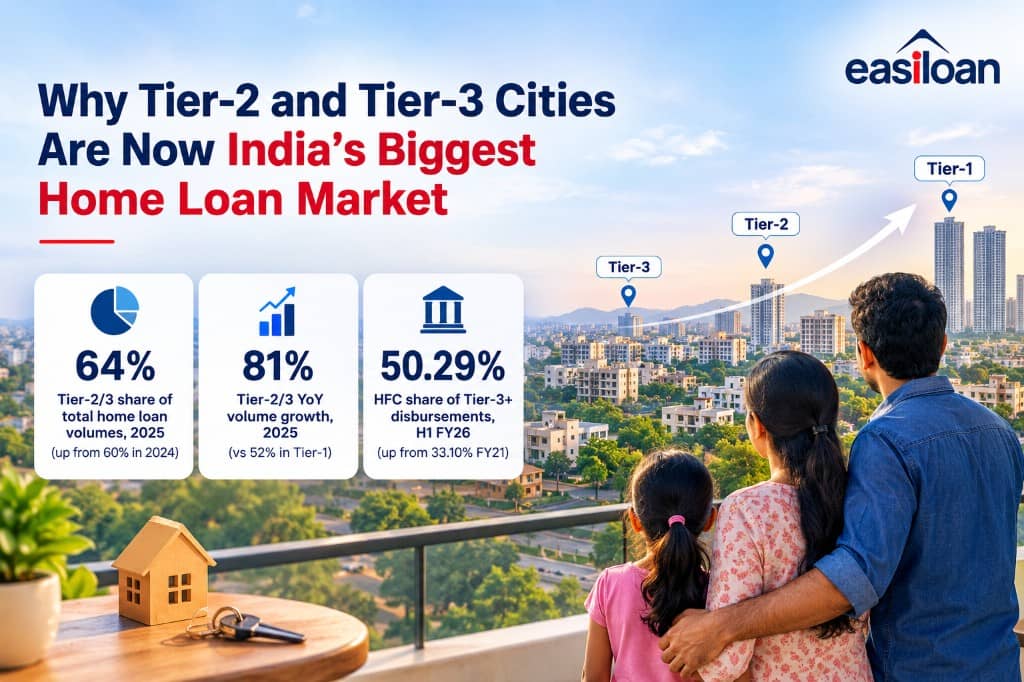
According to the Urban Money Homebuyers Credit Pulse Report, Tier-2 and Tier-3 cities accounted for 64% of India's total home loan volumes in 2025, up from 60% in 2024. More striking is the growth rate: home loan volumes in these smaller markets grew 81% year-on-year in 2025, significantly outpacing the 52% growth recorded in Tier-1 cities.
This isn't just a volume story — it's also a lender-mix story. Separate data shows HFC share of disbursements in Tier-3 cities and beyond reached 50.29% in H1 FY26, up sharply from just 33.10% in FY21 — meaning HFCs have built the branch and digital infrastructure to serve these markets directly, and are capturing a growing share of lending there as a result.
Infrastructure spending appears to be a real contributor: the Union Budget 2026-27 allocated roughly ₹12.2 lakh crore for infrastructural development in Tier-II and Tier-III cities, which industry voices link directly to rising housing demand as connectivity and civic amenities improve.
Why it matters for borrowers
If you're a first-time or mid-income buyer in a Tier-2 or Tier-3 city, this data suggests you're part of the fastest-growing, not a secondary, segment of India's housing finance market — lenders are actively building capacity and competing for this business.
64%
Tier-2/3 share of total home loan volumes, 2025 (up from 60% in 2024)
81%
Tier-2/3 YoY volume growth, 2025 (vs 52% in Tier-1)
50.29%
HFC share of Tier-3+ disbursements, H1 FY26 (up from 33.10% FY21)
Example
A first-time buyer in a Tier-3 city today is statistically more likely to be financed by an HFC than by a traditional large bank, reflecting how significantly HFC distribution has expanded in these geographies over the past five years. HFCs serving these markets have often built more localised underwriting and digital-first processes suited to first-time, mid-income borrowers who may not fit a large bank's traditional documentation-heavy process as easily.
Industry commentary links this to several durable drivers — rising incomes, continued urbanisation, Smart Cities Mission and AMRUT 2.0 infrastructure spending, and growing Account Aggregator-based underwriting — framing this as a structural shift that adds long-term stability to India's housing finance ecosystem, since growth is no longer concentrated in a handful of metros.
What should homebuyers do?
- If you're in a Tier-2/3 city, actively compare HFC and bank offers — HFCs have meaningfully expanded their footprint.
- Take advantage of growing digital application processes, which reduce the historical friction of applying outside a major metro.
- Factor local infrastructure spending into your property decision — areas benefiting from Smart Cities Mission or AMRUT 2.0 investment may see stronger medium-term value appreciation.
- Don't assume metro-city loan products and pricing automatically apply — Tier-2/3 specific products and eligibility can differ meaningfully by lender.
- If you're a first-time buyer, ask specifically about products designed for first-time and mid-income borrowers.
Comparing HFC and bank offers in your city?
See which lenders are actively competing for your profile.
Try the EMI CalculatorFrequently Asked Questions
What counts as a Tier-2 or Tier-3 city for this data?▾
Classification varies by source, but generally follows population-based government or industry categorisations — the specific list varies across reports and isn't always identical.
Why are HFCs gaining share specifically in smaller cities?▾
HFCs have built deeper branch networks and digital infrastructure in geographies that large banks have historically served less intensively, allowing them to capture a growing share of disbursements.
Is this growth sustainable, or a temporary spike?▾
Industry commentary frames it as structural — driven by durable factors like urbanisation, infrastructure investment, and rising incomes — though actual outcomes will depend on continued execution of these drivers.
Does this mean home loan rates are cheaper in Tier-2/3 cities?▾
Not necessarily — rates depend on your individual credit profile and the specific lender, not primarily on city tier. What's changed is the breadth of choice and accessibility of financing.
How much of India's home loan market do Tier-1 cities still represent?▾
Based on the cited data, Tier-1 cities accounted for the remaining 36% of 2025 home loan volumes, still growing at a strong 52% year-on-year, just slower than the Tier-2/3 growth rate.
Sources
- IBS Intelligence, "Tier-2 and Tier-3 cities drive India's home loan growth," January 2026
- Business Standard, "Tier-2, Tier-3 cities drive 81% home loan growth, 64% of volumes: Report," 13 January 2026
- Home First India, "Trends in Affordable Housing Financing in India: 2025-26 Analysis," 2026
- Business Today, "Budget 2026: What FM Sitharaman said on growth in Tier II & Tier III cities," 1 February 2026
- Mordor Intelligence, "India Home Loan Market Size & Share Analysis," 2026
- SocialNews.XYZ, "Tier 2, 3 cities to drive next wave of India's home-loan growth as digital lending soars," 2 September 2026
Information in this article reflects publicly available data and reporting as of the "as of" date stated above. Figures tied to a live or proposed RBI decision may change once a final announcement is made — always confirm the latest position with your lender. This is general information, not financial advice. EMI figures are indicative estimates. Home loan rates, spreads, fees and eligibility vary by lender and are subject to credit appraisal.